
Why Exhibit at a Conference in the First Place?
Face-to-face conferences create meaningful interactions, connections and activations with prospective members and customers. Educational programs and exhibitions compel both prospective members and customers to attend to seek value that translates to new knowledge and expanded networks.
- For Association and Society hosts and organizers, conferences and exhibitions are a rich revenue source and a productive channel to bring forward education and knowledge for its attendees.
- For Exhibitors and Sponsors, conferences and exhibitions can aid in creating broad brand awareness, introduce new products and lead to generating interest across a highly targeted audience. These events can also generate cost-efficient sales and move prospects more quickly through the purchase pipeline.
However, the conference and exhibition sector is under increasing pressure to perform and evolve in a dynamically changing environment. Some are experiencing decreased year-over- year attendance resulting in both short- and long-term revenue impacts. Formerly committed attendees are questioning their value, don’t have time to commit or can no longer afford to attend.
Decreased attendance leads to deeper revenue consequences as once-committed exhibiting companies begin to see there may be less value delivered when they factor in the expense to exhibit. Fewer prospects or curated opportunities with existing customers result in fewer sales — while costs to exhibit increase.
Associations and Societies must seek to create engagement, improve relevance, become competitive and most importantly leverage a strategy built around data.
Let’s begin by summing up what we see as a variety of key challenges, forces and demands across the dynamically changing environment.
The Attendee Market: Changing Behaviors
In terms of driving or saving revenue, time is today’s currency. Formerly dedicated attendees or attendee prospects find themselves with less and less time and more and more to do — and are more indecisive about committing to a multi-day or week-long conference. Digital remains a strong source of information and knowledge; today, online delivers much of which was formerly only available through attending a conference.
Here are five key factors to consider that result in diminishing audience numbers:
- Growing quantity of similarly themed conferences, conventions and events fractures audience.
- Expansion of available online educational offerings creates less need for in-person experiences.
- Individuals, regardless of age, are more comfortable being in control in using online sources to gain knowledge.
- Travel and registration fees are increasing and attendance may become cost prohibitive.
- Networking can be achieved digitally and, in many regards, more productively.
That being said, it’s important to be aware that there is some recent contradictory research focused on digital adoption. In the era of fake news, individuals are becoming more suspect of the information and knowledge delivered to them via digital means.
Digital-savvy individuals want online relationships with organizations, businesses and groups who maintain authority and credibility. When neither of those are present, they move along. They want to align in a relationship of trust -add to trust, the need for meaning. According to Reuters Institute, individuals are increasingly conscious of the time they are wasting online, so we are seeing more people leave social networks, an increase in the number of tools for digital detox and more focus on meaningful content.
Digital detox and the desire for stronger trust relationships can aid those holding in-person conferences and exhibitions to stabilize and potentially grow attendance. The key is positioning, marketing and value delivery that matches the building of trust, relevant engagement and leveraging of data to ensure performance.
Increases in Competition
Competitive forces are increasingly at play for Associations and Societies whose conferences had historically been where professionals flocked. Look around; even do a Google search: media companies and publishers are expanding and adding new events, which increases competition for exhibitor and sponsorship dollars. These new events are slowly chipping away at your loyal members and customers who come to your events and conferences every year.
In summary, possible market segment saturation can impede growth, fracture your audience and lead to further decreased attendance.
Exhibiting Companies Want More Data
Exhibitors and sponsors are increasing their demands.
Companies that exhibit and sponsor know what data can be captured and they are demanding the data to justify their spend and expense. This is particularly acute for Associations and Societies who are experiencing a downshift in year-over-year attendance.
The quantification and qualification of leads that exhibitors and sponsors seek has become more complex. The norm now is catching the right fish, not any fish, because companies know data can be leveraged to identify the right prospects and establish the right relationships.
Associations and Societies must step up to the plate and match its exhibiting and sponsoring company’s needs and demands.
Reasons to Exhibit or Sponsor Are Evolving
Companies generally exhibit for the following reasons:
- Create broad awareness and gain broader audience.
- Generate sales with prospects and curate current customers.
- Move prospects more quickly through the pipeline.
- Shorten time to close prospect sales.
- Leverage F2F time with prospects and current customers.
Freeman’s 2019 Market Research Study reports 78% of recent respondents who exhibit say relationship-building across current and prospect customers remains a major goal.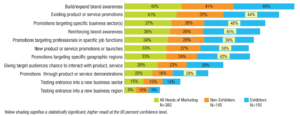
The previous goal could be described as the correlation of how many attendees are present and the belief that they may represent a company’s desired target. In today’s marketplace, companies seek data to determine and understand the detailed demographics and professional interests of individuals and groups of individuals who may represent the 100 most qualified targets — opposed to the thousands of individuals who might possibly be interested.
The Need for a Data Strategy
As we have brought forward, the conference and exhibition industry is swirling with conflicting and challenging factors, opportunities and forces. Data and data strategy stand as an aid, a must-do and must-have — and must come with a thoughtful sense of urgency for an Association or Society.
Some organizations are collecting and leveraging data, but they represent the minority. A variety of data points bring forward the continuing challenges in matching demands, increasing attendance, increasing engagement and turning data promise from vapor to value.
- 57% of respondents say data and measurement have become critically important to their company/organization.
- 21% are using data in any form to measure ROI and sales impact from exhibitions.
- 58% view measurement of data a significant challenge.
- 20% use data to understand attendee journey.
- 86% rely upon registration data.
- 20% are using dwell time as an indicator.
- Most report that data is confusing and value elusive.
Source: Freeman Marketing Survey
Before you develop a strategy for leveraging data for retention and revenue, do a reality check. There is a lot of hype out there pushing for complex, often expensive, data solutions. Most of it is more vapor than value.
How do you start the process for making the right choices and decisions?
First, you need to recognize three essential items before you begin:
- Your business goals and needs must be clearly articulated.
- Data interpreters and data definitions are needed.
- The purpose, plan and results of the strategy must be clearly defined.
Let’s consider possible goals before you research tools, vendors or solutions. Your goals may include:
- Increasing attendance, engagement, immersion and participation.
- Improving/expanding attendee and exhibitor experience.
- Improving planning and “right-sizing” logistics, space needs.
- Improving overall programming and program planning/management.
- Increasing value to sponsors and exhibitors.
- Or, all of the above, plus more.
The identified goals can lead to the following results:
- Protection and growth of year-over-year revenue and value.
- Maintenance and growth of industry (exhibitor/sponsor) value and relevance.
- Deepened member and customer relationships.
- Growth of your value proposition.
Now consider your strategies for reaching your goals:
- Expand demographical data collected via the registration process.
- Implement audience response systems to encourage engagement.
- Introduce beacon tracking to know what attendees do and where they are.
- Expand mobile with contextual recommendations to create awareness and interest.
- Leverage marketing automation to increase delivery of relevant content.
And, identify key questions to answer via data:
- Who engages with what?
- What are the distinct segments across our attending audience?
- Who visits whom and why?
- What messages should be sent to whom?
- Whom do we target?
Using only intuition and observation married to past performance may present challenges in determining how to establish content (education) that increases engagement (relevance) and continues to increase the connective value of exhibitors and sponsors to the right attendees (revenue).
Why are data definitions and having data interpreters important? Planning and executing conferences and exhibitions are herculean across the myriad of tasks, relationships and details that must be managed. Complexity leaves little time for digging deep into repositories of data, mentally processing the data and figuring out what the data is telling you.
Defining different types of data becomes critical as each action, demographic or individual or paths of behaviors collected has different meaning and value. A tweet from an attendee or an email open should not have the same value as that attendee’s detailed interests, session attendance, duration in session, audience engagement responses or position type.
Values and definitions must also be detailed and understood where the career stage of a type of some professionals may be different from the career stage of other professionals attending. The need states are different, the interests are different, and the content sought is also usually very different and chosen for different reasons.
A simple formula across data types can lead to actionable knowledge and insight:
Type + Quantity + Length + Identity + Participation + Needs can bring forward:
- Educational and content trends.
- Attendee engagement and experience trends.
- Educational gaps across attendees.
- Industry or exhibitor gaps in who is there and who else should be
Definitions and correlated values for each can be leveraged and co-joined; the data is then interpreted by those who are stewarding the data and the processes and have the responsibility to mine the data and share the results.
Data Tools and Collection Platforms to Consider
Using a suite of tools and platforms to entice engagement and create offerings allows for data collection and management, which individually and together provide for measurement to determine if you are achieving your KPI goals and/or if there are areas in which you need to improve.
Here are some individual options to consider that individually provide value but together provide all the data you need to increase retention and revenue. Data correlation across several years should be your goal. Download the ATS Case Study to learn more about year-over-year plans and strategies.
- Beacon Tracking delivers an understanding of movement, consumption and engagement by individual and herds of similar individuals correlated to program content and activities.
- Web-based Audience Response ensures research capture and reporting needs are met and exceeded for content planners by capturing all response data. It enables multiple poll, survey and Q&A types including an open “social capture.” It can capture response via session, topic and interest area (across grouped sessions). Response data can reveal individual and groups of individual educational and information gaps while bringing forth correlation to educational objectives and actual retention and comprehension.
- Mobile Enhancements leverage attendees’ devices for engagement/interaction and therefore improve onsite attendee engagement. It also delivers appropriate, personalized notifications that provide value by schedule/program and guided navigation interaction. Additionally, it provides attendees with an enhanced ability to network with fellow attendees.
- Marketing Automation connects digital and physical consumption to understand content Interests and preferences and education needs. It also tracks behaviors, segments and targets outreach and deepens relationships.
- Web Enhancements upgrade program display and accuracy, improve registrant interaction with a streamlined process and deliver timely collection and management of communicated interests. Correlated to enhanced mobile features, web enhancements including interactive agenda builders and recommendation engines ensure those who do not connect via mobile have similar experiences for contextualization and personalization.
- Attendee Wi-Fi Access creates infrastructure for attendees to leverage their mobile devices, tablets and laptops (especially international) and entices attendees to be active respondents in sessions. It allows for “free” frequent use of the conference app and improves attendee overall satisfaction. More importantly, device IDs are collected via Geo-Fencing and enable direct delivery of contextualized advertising post conference to lengthen the long tail of engagement and immersion.
- Registration Attribution ensures consistent attribute carry forward and back across all primary data sources. It enables easy cross and combined data mining and reporting and connects attributes to consumption and other behaviors across physical and digital experience.
- Data Repository and BI Toolset establishes a data repository to capture all collected data and enables the ability to generate business intelligence and views into data. It aggregates different sets of captured data for 360-degree views and provides historical basis for future data collection. It is also the connection and platform to bring forward data from other systems within your association or society (an opportunity to understand and measure overall association or society engagement from members, customers and attendees over time).
Comparable Data for Retention
Comparable multi-year data is crucial to measure overall performance, create look-alike herds, and understand changing trends. It also guides the long tail planning process and measures behavioral and consumption data for segmentation and personalization.
Specifically, comparable data helps to create understanding of key motivations for attending, joining, subscribing and renewing; exhibitor relevance; providing the right message to the right people and if an association or society is relatable, authentic and meets individuals in ways that position to addressing the recipients need state.
For all involved, comparable data can help build a multi-year repository of individual and herd intelligence; understand exhibit hall traffic flow and who visits the exhibit hall and when; how many booths attendees visit over the period of the event and how long attendees spend in a booth. Exhibitors can also be provided with data to understand aisle traffic (who walked by but did not stop) and capture foot traffic/impressions for meter boards and other sponsored advertisements and signage.
For all involved, comparable data can help build a multi-year repository of individual and herd intelligence across sessions, activities, content engagement, content retention and comprehension while providing the basis for long tail engagement post conference leading into the following year conference.
Engagement is activated and can be strengthened when data is used for the following:
- Hyper-segmented and targeted communications.
- Social tracking and collection.
- Automated content delivery.
- Content connection to registration customized emails.
- Targeted web page experiences.
- Recommendation engine (pre-conference agenda build and onsite).
- Automated notifications based on behaviors.
- Detailed long tail experiences focused on attendee needs.
The American Thoracic Society: Blazing Trails
The American Thoracic Society, working with 2040 Digital, LLC, is now four years into building a data collection machine that serves to create intelligence while deepening the engagement of its attendees and its members.
Download the ATS Case Study Presentation delivered this past August at the Healthcare Conference and Exhibition Association (HCEA) Conference by Stacy McManus, Senior Director ATS Incubator and Kevin Novak, CEO, 2040 Digital, LLC.
Alternately, come see Stacy and Kevin present the ATS Case Study live this December at IAEE’s Expo!-Expo! In Las Vegas.

End Notes
Implementing the right data solutions takes time; start planning earlier than you think! You need the right help with the right expertise across education, program and exhibits. You also need to have clear and detailed plans on what data is and isn’t critical. Define data models and values that align with your long term-plan and desired outcomes. Be prepared for surprises as data is consumed and perceptions are validated or changed. New data will also identify new opportunities to fill gaps and develop new offerings.
The endgame in meaningful use of data is to improve key performance metrics and increase the value your attendees gain and raise value to the prospect attendees you seek:
- Increase conference registration and engagement.
- Improve member and attendee engagement and retention.
- Improve exhibitor retention and expansion of exhibitions.
- Increase and expand consumption of educational and publications content (deepening value awareness).
- Increase and improve programming relevance to attendee need.
- Improve overall organization value proposition and value delivery.
2040 Digital is always here to help you navigate the digital landscape and identify the right solution for your particular needs. Contact us!
Read More about Member Engagement and Data or Read our Matching the Needs of Healthcare Providers Series.